
The Fuel and Engine Bible - how engines work including 2 stroke, 4 stroke and wankel (rotary) engines, fuel, octane rating, power, bhp, gas types and grades, carburettors, fuel injection, tuning, tweaking, nitrous, turbos, superchargers, chipping, hybrids, how to keep your engine running at peak fitness and much more.
The Fuel & Engine Bible
Gas-mileage, mpg and why American cars can never match the EPA estimates
Gas-mileage is the quickest indicator of how efficient a car is in terms of fuel used for distance driven. Engine size and power, driving conditions, weather (wind especially) and vehicle weight all affect mpg. Measuring gas-mileage is really easy but it's surprising how many people don't know how to do it. Basically, zero your trip counter next time you fill up, then drive as normal. When you fill up again, let the petrol pump fill to the auto-cutoff point and then make a note of the trip meter reading. Gas mileage is the number of miles on your trip meter divided by the number of gallons the petrol pump put into your tank. You'd be surprised the number of people who use the manufacturer figure for the size of the tank in that calculation instead of the amount of petrol actually put in.
In England and Europe, pumps deliver in litres, so in the UK it's miles-per-litre, although most advertising still uses miles per gallon. It's worth noting that an English gallon is 1.2 US gallons. So when you see a car in England that advertises 40mpg, it's the equivalent of 33mpg in the US.
In the rest of Europe it's normally advertised as litres per 100 km. So for example, 28mpg (UK) is about 10litres/100km. Often this is short-handed to 1-in-10, meaning 1 litre used in 10km of driving.
The EPA
The American EPA (Environmental Protection Agency) rates all cars sold in America with gas-mileage figures, advertised as EPA-rated mpg figures on the new car sticker. It's one of the things car manufacturers rely on to sell their vehicle, especially with today's high fuel prices. Not many people understand this, so I'm here to take some of that confusion away and tell you what the EPA figures really mean.
Historical context
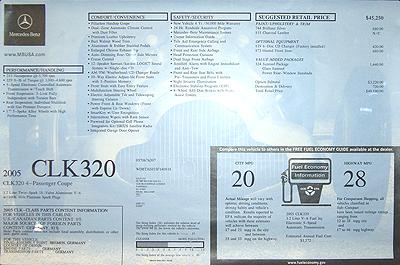
In the windows of every new car in an American showroom you'll see an EPA information sticker, an older example of which is seen on the right (see below for the latest revisions). There's a load of technical blurb on there to advertise the vehicle, but on the older stickers there were two big numbers; the EPA-certified fuel information figures. In this case 20mpg city and 28mpg highway. So you'd see these figures and you get into your head a rough idea of how often you'd be filling up. The problem is that these were very rough estimates.
In the 1980s, the EPA conducted a study on their results vs. the real world, and discovered most drivers got significantly lower mpg figures than the EPA predicted. As a result, EPA estimates on the new car labels were dropped by 10% for city and 22% for highway from their actual results. In 2006 they dropped another 8% from those figures again to try to make the numbers match more closely.
Even that isn't the end of the story though. What you really need to know is how the EPA came up with their figures in the first place. Before you carry on, you might want to put down any drinks or breakables because I know what your reaction will be at the end of this. Ready?
EPA testing procedures
Congress and car company lobbyists required the EPA to measure mpg figures using the following simulated real world conditions in a lab. That's right - EPA testing happens on a dyno in a lab, not on the open road.
- Average highway speed : 49mph
- Maximum highway speed : 60mph
- Temperature : 75°F
- No rapid acceleration
- No air conditioning
- No passengers
- No rough roads
- No hills
- No wind
- No low tyre pressures
- No ethanol in gas
The first problem is the last point : no ethanol in gas. In America, it's almost impossible to buy zero-ethanol petrol - it's all E-10 (see E10 elsewhere) so you're already going to be down 5% on the EPA figures even if you could meet all the other requirements. And who drives like this? 49mph on the motorway? Maximum speed 60mph? Perhaps when the model-T Ford was the Big Thing, these were valid speeds, but nowadays (and by 'nowadays' I mean 'in the last 6 decades') motorway speeds are typically 70mph maxing out at 90mph (if you're in Europe anyway). What about the rest of it - no hills, no passengers, no rough roads? Have the EPA actually driven a vehicle in the real world recently?
As a rough benchmark, driving at 65mph instead of 49mph will decrease mpg by 20%. Driving at 75mph will take another 25% off that. In short, you could pay very little attention to the EPA estimates because they were, for the most part, completely meaningless.
Trying to give you a concise answer.
They say a picture speaks a thousand words. I don't have a picture for you but I do have a table. This is a quick reference for you to show all the various figures that went into the EPA estimates, the advertising and what you should expect in the real world. It's based on the Mercedes CLK320 sticker shown above. The blue row shows what you'd see on the EPA sticker in the window of the car. The red shows the figure you'd see on TV (eternal optimism) and the green row shows what you should expect when you drove this car in the real world.
| City Low | City High | City Avg. | Highway Low | Highway High | Highway Avg. | Combined Avg. | |
| EPA LAB TEST | 21.6 | 26.3 | 23.9 | 26.3 | 42.1 | 34.2 | 29 |
| -15% (1980 correction) | 18.4 | 25 | 21.7 | 25 | 35.8 | 30.4 | 26 |
| -8% (2006 correction) | 17 | 23 | 20 | 23 | 33 | 28 | 25.5 |
| -5% (you're using E-10 petrol) | 16.1 | 21.8 | 19 | 21.8 | 31.3 | 26.6 | 25.1 |
| What you should expect | 15 | 20 | 17.5 | 20 | 30 | 25 | 21.2 |
Conclusion : the EPA numbers were essentially useless
Yes, apart from for one thing. Too many people tried to perpetuate the myth that the EPA values were intended to suggest what a driver could expect to get in the real world. As I've shown in mind-numbing detail above, this was simply not the case. Instead, they were best used as a comparison between one vehicle and another, ie if one vehicle was EPA-rated at 20mpg and another at 25mpg, then you could pretty safely conclude that the latter gets 25% better mileage than the former, and nothing else. For a good read on this subject see the Patrick Bedard column in the Feb 2006 issue of Car and Driver magazine.
2008 : The EPA adjust their figures
Skip forward to 2008 and finally the EPA changed the way they measured mpg figures. The big changes are:
- The new tests start with the car at 20°F. The old tests started at 75°F. Why the change? A cold vehicle uses more energy than a warm one. Cold temperatures are especially hard on the batteries that power hybrids, so hybrid mpg ratings dropped.
- The new tests use a maximum highway speed of 80mph instead of 60mph. At that speed more engine work is done to overcome drag than to actually keep the vehicle moving at speed.
- The new test includes hard acceleration. The old test used gentle acceleration. This one also affects hybrids because hard acceleration relies entirely on the regular petrol engine and uses none of the electric hybrid parts.
- The new test now assumes air conditioning is used 13% of the time. The old test didn't use air conditioning at all. 13% is the mean average for all major cities across all times of year for the US.
But even with these new standards, the EPA test still takes no account of hills or wind. This has the effect of skewing the test in favour of larger vehicles like SUVs. If hills and wind were included, the results would be radically different - larger, heavier vehicles use more energy to travel into wind and up hills, ie. more fuel. The 2008 EPA estimates would be far more useful if they included these factors. Because they don't the overall fuel consumption figures for SUVs are lower than is realistic.
For example. Assume a car gets 40mpg without the hills and wind test, and 38mpg with. Now imagine an SUV doing the same tests gets 24mpg without the hills and wind, and 19mpg with. For the sake of comparison the car's 40mpg vs. the SUV's 24mpg doesn't look as bad as the car's 38mpg vs. the SUV's 19mpg. But I digress.
So what's the outcome of this? Well first of all, the new figures are definitely much closer to what you or I could get from a real car in the real world and this can only be good news. Hybrids still suffer a hit of about 30% loss of mpg for highway and 20% for city. Regular non-hybrids will drop about 12% for highway and 8% for city.
So it's a lot closer to the real world than it was, but is it close enough or should we still just use the EPA figures as an arbitrary comparison of vehicle mpg as measured against an arbitrary scale? Time will tell, but it could be argued that the major car manufacturers and oil companies lobbied for this change to take the shine off hybrid vehicles - after all, they're the ones that suffer the most with the new rating.
2011: New EPA stickers with more information
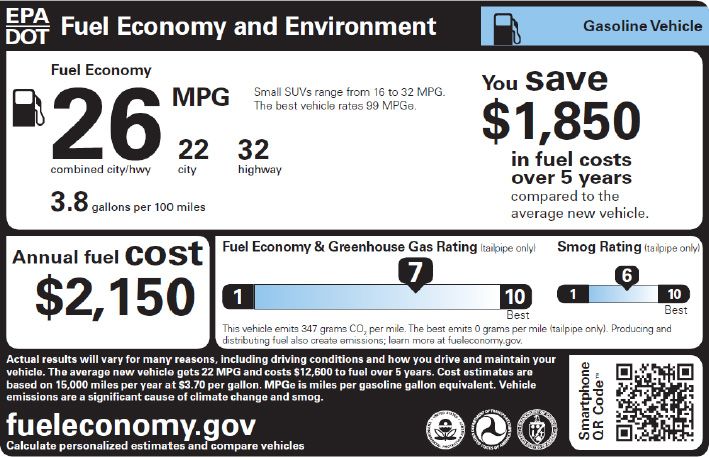
Time marches ever forwards and so do the EPA. In 2011 they introduced the latest version of their informative window stickers. In addition to the baseline mpg, they now contain further breakdowns of information such as the number of gallons per 100 miles, bringing them in-line with the sort of figures Europeans are used to seeing - litres per 100km. There's also smog and greenhouse gas ratings, again very similar to the European ratings for grams of CO2 per km. On the right there is a 'savings' figure that compares the sticker of the car you're looking at to an 'average' car. The details of the 'average' car are stated in the white text in the black box underneath: it gets 22mpg and costs $12,600 in fuel over 5 years assuming 15,000 miles a year at $3.70/gallon for petrol. This allows you, the consumer, to do some mental maths based on fluctuations in your own mileage and the price of petrol.
Finally there's a QR code that you can scan with a mobile device which will take you to a site with more information about the vehicle in question, and an annual fuel cost estimate. All in all, a nice revision to the label, designed to make it much more obvious just how much of a petrol-hog that new SUV that you're eyeing up really is. The information is far more clearly presented and there's a lot less ambiguity about "between" figures.
New stickers for the latest generation of cars. In addition to the overhaul of the petrol sticker, the EPA introduced a standardised sticker for E85, diesel, LPG (CNG), hybrid, plugin hybrid, hydrogen and full electric vehicles at the same time. The full set of 2011 EPA stickers can be downloaded here as a PDF or you can see them on the EPA's fuel economy website at www.fueleconomy.gov.
If you're curious about what others are getting in the real world, there's three websites that will help you out:
the fueleconomy.gov site mentioned above is the US government's own website where people like you and I contribute to their real-world mileage database.
GreenHybrid.com which is based more on hybrid vehicles, and TrackYourGasMileage.com.
2015: VW 'Dieselgate' scandal
If you've read through all the history of the EPA above, it'll come as no surprise to learn that car manufacturers were able to write software into their engine management systems that could guess when the car was being tested in a lab. Volkswagen were the first to be found out when it turned out some of their diesel engines emitted 30 times the amount of NOx when driven on the road as they did when they were in lab conditions. But it wasn't just VW. In the days and weeks following the VW revelation, companies starting doing real-world tests both in the US and in Europe. Cars produced by Honda, Mazda, Mitsubishi and Mercedes-Benz were found to emit more NOx than was previously recorded, in official testing by a company called Emissions Analytics. They found that in real-world conditions some cars built by the four manufacturers emitted 20 times the NOx limit from their exhausts. Emissions Analytics analysed about 50 Euro-6 diesel-engined cars and 150 Euro-5 diesels on-road. 195 of the 200 cars tested had real-world NOx emissions that were significantly higher than the regulatory laboratory test. Yet all the cars tested supposedly passed EUs official lab-based NEDC (New European Driving Cycle) test (Euro-5 and Euro-6).
On top of the Emissions Analytics tests, ADAC, the largest automobile club in Europe, also tested cars on-road, and it too found that models produced by Renault, Nissan, Hyundai, Citroen, Fiat, Volvo and Jeep all emit over 10 times more NOx than the levels revealed by current EU tests.
In November 2015, the EPA finally buckled and indicated that it would test all new cars on actual roads instead of in lab conditions. The EPA have been doing these sorts of roads tests for decades on trucks - they've just never done them on cars. They are not the only ones changing the way they do emissions testing. European bodies are looking at real-world testing too although their system isn't due to hit the roads (pun intended) until 2017.
The sting in the tail of this story is the get-out clause though. The EPA say that the lab tests will remain as the 'benchmark' and that road tests will only be carried out to try to find defeat devices. So close and yet so far. What they need to do, of course, is get rid of the lab tests completely and road-test all the vehicles.
Calculating your own carbon emissions
American and European cars both report gas mileage and carbon emissions in their advertising now. The same is likely true of most other countries. Calculating your own carbon emissions from a given gas mileage figure isn't particularly complicated though.
When burned, 1 US Gallon of petrol produces 8.7kg of CO2 and 1 UK Gallon of petrol produces 10.4kg of CO2. European ratings are grams per km whilst US ratings are grams per mile. So for example if a US car is rated at 26mpg:
26 miles = 1 gallon = 8.7kg of CO2
26 miles = 8700 grams
1 mile = 334 grams CO2 / mile
There can be some variation in this basic calculation, for example vehicles with automatic stop-start engines (that stop when the car isn't moving, and auto-start when you take your foot off the brake (automatic) or put a foot on the clutch (manual) can have lower ratings because the engine isn't burning fuel when the car is stopped in traffic.
This explains why in many countries, the vehicle tax is levied on CO2 emissions. The more fuel-thirsty the car, the higher the emissions and thus the more tax you pay. Simple.
The transatlantic conundrum
Here's a question for you : why do identical cars, made by the same manufacturer, get less mpg in America than they do in Europe? I know a lot of you are reading this now thinking "Aha - that's because an imperial gallon is larger than a US gallon". Yes, but even adjusted for that, it's still true. Take for example the 2008 Honda Civic 1.8 i-VTEC 5-door manual. It's a good example of an average family saloon/sedan car. The trim levels are identical, as are the engine and gearbox, and power and torque figures. Oddly, the European cars weigh more for the same trim level. The following are all converted to US gallons:
| City mpg | Highway mpg | Combined mpg | Peak power | Peak torque | Kerb weight | |
| UK | 28 | 43 | 36 | 140hp @ 6300rpm | 128lb.ft @ 4300rpm | 1281kg |
| US | 26 | 34 | 29 | 140hp @ 6300rpm | 128lb.ft @ 4300rpm | 1241kg |
Another example saloon / sedan car. The 2008 Volvo S40 2.4i. Again - same trim level, engine and gearbox. Once again, the European car weighs more:
| City mpg | Highway mpg | Combined mpg | Peak power | Peak torque | Kerb weight | |
| UK | 20 | 37 | 28 | 170hp @ 6000rpm | 170lb.ft @ 4400rpm | 1481kg |
| US | 20 | 28 | 24 | 168hp @ 6000rpm | 170lb.ft @ 4400rpm | 1460kg |
Doing the test differently
Typically, the EU mpg test is now also done on a rolling road and takes less than 20 minutes (1180 seconds if you must know):
- Urban (city) : cold engine, accelerations, steady speeds and decelerations. The average speed is 12mph representative of city commute speeds (very harsh on mpg) and the distance is 4.5 miles.
- Extra-Urban (highway) : warm engine, accelerations, steady speeds (50% of the test) and decelerations. Max speed is 75mph, average speed is 39mph, distance is 4.3 miles.
So why the huge difference? You'd expect the figures to be within a couple of percent of each other, but they're clearly not. In fact with the EU cars weighing more you'd expect their figures to be worse. I've heard from engineers who work on economy testing for the major car manufacturers and the same theme always comes out - driving the same car with the same engine through the European (NEDC) and American (EPA Combo) tests can often yield as much as 20mpg difference between the cycles. Most of the difference comes from the cycle itself. The EPA cycle has much more violent accelerations, more harsh braking and is very transient, hardly any of the cycle has constant speed cruising. Some of the accelerations in the EPA cycle require near WOT (wide open throttle) on an engine with 170Nm of torque. The EU cycle on the other hand hand has extremely gentle accelerations and all the cruises are at a constant speed, naturally yielding much better mpg.
There is also a different calibration between the US and EU engines and the US engines have a higher loading of precious metals in the cat to soak up more emissions, but these changes will not make a large MPG difference. There is a small amount of enrichment and ignition retard on cold start but once the cat is up to temperature, which happens quicker on the US cycle than EU, lambda 1.0 is always aimed for.
If you'd like to weigh in on this debate (ie, not Big Oil conspiracy), drop me a line. Other suggestions so far:
- Different Petrol Octane/Composition
- Good idea but the calorific value of low-octane fuel is pretty much the same as high-octane.
- European and Japanese cars are designed for higher-octane fuels (higher compression).
- Might be true but most European vehicles run Euro95 petrol, which is the equivalent of American (R+M)/2 89 octane. Plus, the engine specs are identical - same compression ratio, same torque, same horsepower.
- Different Oil Type/Viscosity used
- Different 'Map' on the ECU for different emissions laws
- Tyres - different rolling resistance?
For my money, the best one is the different engine map in the ECU for emission laws, although emission laws are stricter in a lot of parts of Europe than they are in the US which you'd think would make the mpg figures worse.
Reader ideas
The Transatlantic Conundrum has generated more buzz on my email than Lindsay Lohan getting out of a limo with no knickers on. Some of the ideas are quite sensible. Some are way out in left field. Scott Brereton emailed me with one of the more intelligible ideas:
Like yourself I suspect that its related to engine maps, and I think it may be a quite subtle effect of differing emissions laws.
After doing some research it turns out that in the UK emissions standards measure carbon monoxide(CO), hydrocarbons(HC) and lambda. Looking at the regulations for the US, as far as I can tell CO, HC and nitrogen oxides(NOx) are measured. Due to differing test methodologies, I can't make a direct comparison between the CO and HC figures, hence why I'm phrasing all this with lots of 'maybe's.
Since NOx is formed under lean combustion conditions, it might be the case that fuel maps in the US are tuned richer than in the UK to minimise NOx production, this will lead to higher CO and HC but if we suppose that the CO and HC standards required in the US are more relaxed then those in the UK this would not be a problem. This richer fuel map might go some way to explaining the differing fuel consumption figures seen on either side of the Atlantic.
Reader Blaine writes: It's based in the US EPA's pre-occupation with NOx levels. Recall that European smog police pay little attention to NOx, and concentrate on HC, CO, and CO2. Also recall that NOx formation occurs at extremely high temps (2700+ degrees?).
US emissions systems use a catalyst to bring down NOx levels. The problem with this catalyst is that it doesn't work at "low" temperatures - even those typically found in exhaust systems. US emissions systems make this catalyst work by dumping raw fuel (or running an exceedingly rich mixture) into the exhaust stream, to burn in this NOx catalyst to keep it hot enough to perform the reduction reaction to eliminate/reduce NOx levels. This results in somewhat excessive fuel consumption, obviously.
Tuners in the US, on OBD-II vehicles, have figured out that eliminating this fuel enrichment can result in a fairly substantial gain in fuel economy, especially when combined with fuel-map and timing tweaks designed to increase fuel economy in other circumstances.
It's the "good-fast-cheap" triangle: "good, fast, cheap; pick two". Automotive engines are governed by a similar triangle: power, economy, emissions. European ECM's can pick two; American ECM's can only pick one, by federal mandate - emissions (every other consideration - power, fuel economy, driveability, etc - comes in as a distant second place). By going to a more european style of ECM mapping, American tuners can work some pretty amazing feats, and still maintaining emissions levels.
Like the site? The page you're reading is free, but if you like what you see and feel you've learned something, a small donation to help pay down my car loan would be appreciated. Thank you.
Torque and BHP
There are two values that are generally published for an engine which tell you how strong the engine is, and they are torque and bhp - brake horsepower.
Torque is a measure of the twisting power of the engine. Torque is directly related to acceleration; the more torque, the quicker you'll get up to speed. Horsepower is what will keep you at speed once you've accelerated and is directly related to the torque readings. So a high-torque, low-horsepower engine will accelerate well but be unable to maintain a high speed. Similarly, a low-torque, high-horsepower engine will not have much acceleration but will be able to go at a fair clout once it's going.
The difference between horsepower and bhp
In England and the US, horsepower means Imperial horsepower. The technical definition of this is "the power a horse exerts in moving 550 pounds of cargo a distance of one foot in one second." This calculation can include just the horse and its own weight. Horsepower can be defined many ways. One horsepower equals 746 watts, and as such, proper SI units are normally used instead. The term horsepower is more a legacy term than anything else.
The term brake horsepower came about because of an apparatus called a water brake that can be used to measure horsepower. Today all manner of brakes are used from hydraulic to electrical. They all perform the same function though, and that is to load up the engine and measure the torque with strain gauges. BHP figures can be calculated from the measured torque values to determine the power of the engine at any given rotation. If bhp figures are published without any other data, you've got to assume they're measured at the crank. The problem is that once you add on clutches, flywheels, gears, driveshafts and all the other components between the engine and the wheels, the actual power at the wheel is often noticably less. So sometimes you'll see bhp figures noted as "at the wheel". This means the torque has been measured with the wheel being turned through all the above connections to give a more accurate power reading.
In the bad old days, bhp readings would be taken with the engine running in "optimum" condition, ie. with no oil or water pumps attached, direct cold-air injection, super-cooled coolant, no exhaust back pressure or catalytic converters and so on and so forth. Fortunately today there are standards that have to be maintained. Most recently, in 2005 the SAE made some changes to the test procedures to eliminate some of the 'slop' in power measurements, and for car manufacturers to be able to make valid SAE-certified bhp claims, their tests must now be monitored by SAE representatives. The results of this change were interesting if only because the bhp values for engines changed without the engines themselves being modified. For example the Honda Element engine remained exactly the same, but its bhp rating dropped from 170bhp to 165bhp, simply because of the new procedures.
It's worth pointing out that whilst the rest of the world used bhp or kW (kilowatts) to publish power figures for engines, in America they typically used to use hp(SAE) instead, meaning the rated power of the engine as installed in the vehicle, ie including all the engine components, pumps, drivetrain etc. Having said that, even today, all hp(SAE) or SAE-certified bhp figures are taken at the flywheel and thus still don't really tell you how much power is getting to the wheels. The only way to know that is to put your car on a dynomometer (a dyno) and get true at-the-wheel readings.
Calculating horsepower and bhp
The formula to calculate bhp from a given torque reading is as follows:

Pi is obviously 3.14159, the torque value should be in pounds-feet and RPS is revolutions per second - RPM/60. So do a little elementary maths and you can massively simplify the formula down to this:

The formula to calculate regular horsepower from a given torque reading is as follows:
Pi is still 3.14159, but this time the torque value should be in newton-metres. Again, simplified the formula becomes:

Horsepower and altitude
A little footnote here : assuming all other factors are the same - same octane of petrol, same filters, same weight of vehicle etc., you lose about 3% of your engine's horsepower for every 300m / 1000ft above sea level that you drive. Worth knowing next time you go carving up the Stelvio Pass in Italy. At 9000ft, you're a full 27% down on engine power compared to sea level.